Video Tutorial: Create a Responsive Infographic in After Effects

Do you need an eye-catching infographic for a film or video project? In this video tutorial, find out how to build your own in After Effects.
Good infographics bring boring data to life, allowing viewers to visualize complex issues. They are extremely useful, and they happen to be the perfect project to tackle in Adobe After Effects — you only need a few minutes and a bit of experience. In this step-by-step tutorial, I’m going to show you how to put together a responsive circle graph in no time.

Let’s get started.
Step 1 — Build the Graphic
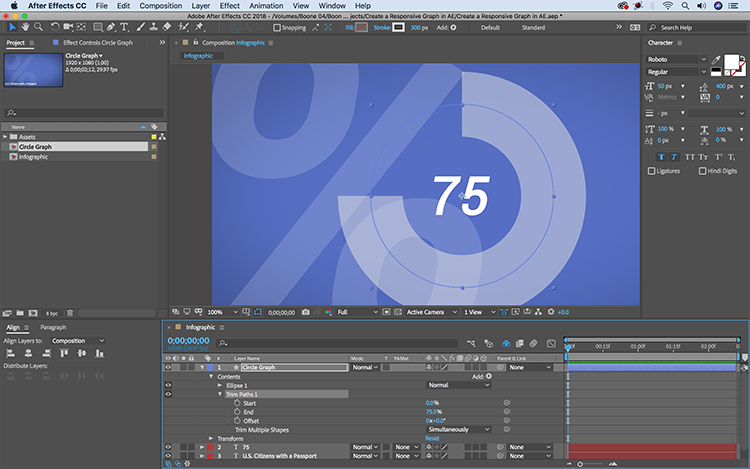
As you can see in the example above, my animation consists of just a few elements. Specifically, I have three text graphics and an animated circle. The number and the circle graph animate in unison. I also have a large percent symbol in the background. To begin, I will quickly recreate the elements of this graphic.
First, to create the circle graph, I will select the ellipse shape tool. I’ll change the Fill and Stroke setting in the toolbar, setting the Fill to “None” and the stroke to “Solid.” Then I’ll make the stroke very thick (300 pixels). Next, I’ll scale the shape layer down a bit and align it to the center of the composition. Now I can quickly add the text, including the graph number, the percent symbol, and the title in the lower left-hand corner.

With all of the graphics in place, I’m ready to prepare them for animation.
Step 2 — Trim the Paths
To bring the infographic to life, I need to add an animator to my circle graph. First, I’ll go to the Add menu button of the shape layer and select “Trim Paths.” This tool has a range selector that allows me to control which part of my circle I want to trim. It includes Start, End, and Offset properties of the circle’s path, all of which are keyframable. When I move the End amount, the graph will begin to trim. I can reverse the direction of the trim in the Path attribute of the ellipse.

I could just go ahead and animate my graph with the range selector, but I want to keep things neat. To do this, I’m going to create a Control layer where I will perform all of my keyframing. This method is very handy when working with complex graphics where you’re keyframing multiple properties. This allows you to keep all of the keyframes on one layer.
Step 3 — Add a Control Layer
To add the control layer, I’ll go to Layer > New > Null Object and then simply rename the layer “Controller.” This particular animation uses a number of expressions to make things work, but don’t let that scare you away. We can create these expressions using good ole pick whips, which are quite easy to understand. The latest version of AE even has Property pick whips, meaning you don’t have to manually add an expression and then use the expression pick whip. Pick-whipping a property will automatically add the expression for you.

Since I’m using an expression, I’ll want to use an expression controller on my control layer. I’ll basically be linking my graph to the expression control, and then keyframing the controller to create the animation. To add the control, I’ll grab the Controller layer and select Effect > Expression Controls > Slider Control. Now I’m ready to link everything up.
Step 4 — Link the Elements
First, I want to link up the Circle Graph to the Controller layer. For this, I’ll grab the End property pick whip of the Circle Graph’s trim path. Again, property pick whips are relatively new, so if you’re using an older version of Adobe AE, then you’ll need to first create an expression on the End property. To do this, simply alt-click the Toggle Animation button for the End property. Now you’ll see an expression pick whip available.

Drag the End property pick whip, and release it over the slider control on the Controller layer. You can view the slider control via the Effect Controls panel or in the timeline. After you do this, you’ll be able to control the graph with the slider.
Next, I’ll grab the pick whip of my number layer’s Source Text, and link that up with the slider control as well. Now all of my elements are linked and ready for animation. I can rename the slider control if I’d like to keep things a bit more organized.
Step 5 — Animate the Graph
Animating the graph is as simple as adding keyframes to the slider control on the Controller layer. As soon as I view my animation, however, I notice that my numbers are using decimals. I’ll need to add one final expression to tell the animation to use round numbers. For this, I’ll alt-click my slider control to add an expression. Next, I’ll open up the Expression language menu by clicking on the small triangle. Select JavaScript Math > Math.round(value), and then voilà. A responsive infographic.

Math.round(value)
You can use this method to customize a variety of different designs — change the colors, the stroke width, the end caps, or even create an entirely different bar graph setup. The key is to link up everything using shapes, trim path operations, and expression controls. If you still feel uncomfortable with expressions and expression controls, check out my other tutorial on slider controls.


